Part 2: The Settlement Test & Why Geography Can’t Explain the Great Circle
Ancient monuments cluster at 5× expected. Settlements in the same river valleys don't. Six databases confirm it.

Update (March 25, 2026): A post-publication sensitivity analysis identified that the Monte Carlo baseline used in this article inflated Z-scores by placing synthetic sites in the ocean. A land-constrained correction reduces the headline monument enrichment from 5× to 2.52× (Z = 11.83 → 6.74, a 43% reduction). The monument-settlement divergence, deep-time enrichment, and all qualitative conclusions survive the correction. Per-type enrichment ratios (36× for pyramids, 64× for geoglyphs) are sensitive to spatial pseudo-replication within monument complexes and should be interpreted with caution. Updated preprint: doi.org/10.5281/zenodo.19212669
In Part 1, we ran the first rigorous statistical test of the Great Circle alignment: Jim Alison’s observation that many of the world’s most famous ancient monuments appear to fall along a single circle on the Earth’s surface. Using 96,383 sites from two independent databases, we found a signal far beyond chance: Z = 25.85, with 319 sites clustering within 50 km of the line versus 89 expected.
A Z-score measures how far a result is from what random chance would produce. Z = 2 is the conventional threshold for “probably not a coincidence.”
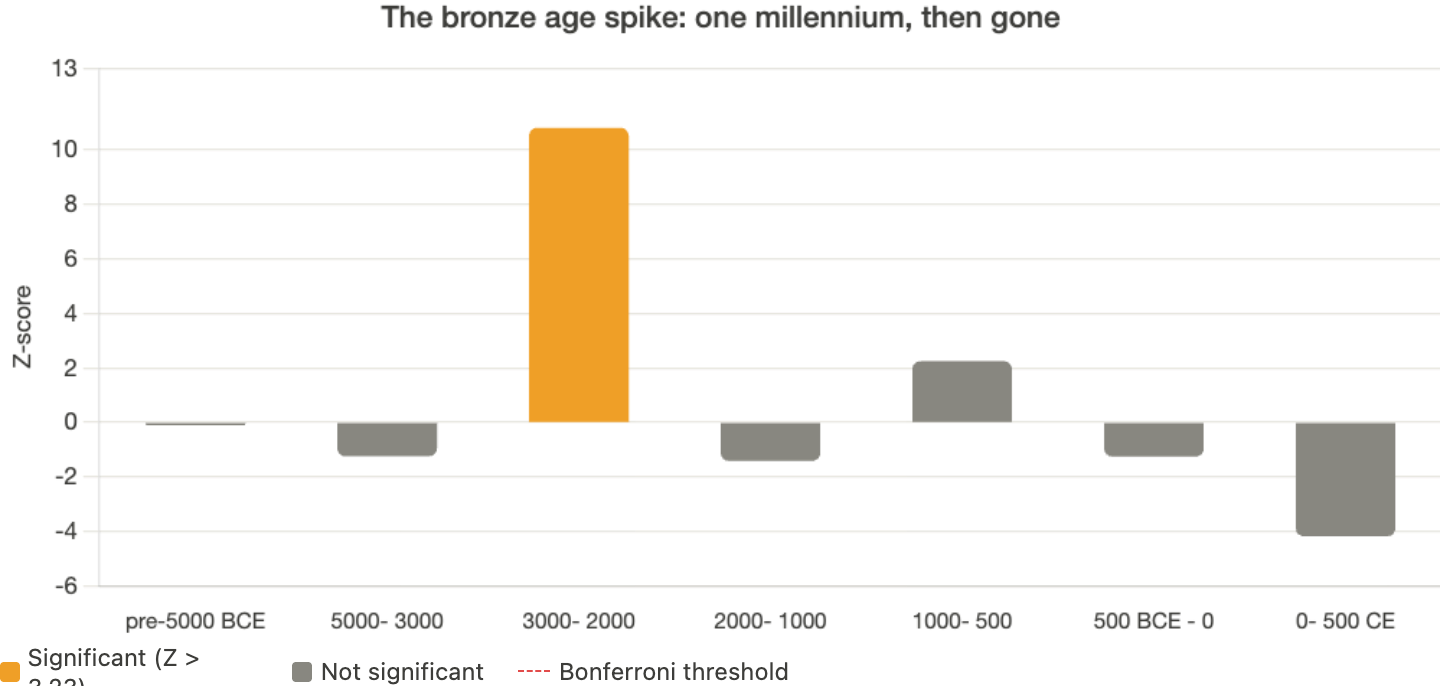
We confirmed the signal gets stronger the older the sites are, and identified six geographic clusters spanning four independent origins of civilization. When we broke the data into millennia, the signal peaks sharply in 3000–2000 BCE — the era of the Giza pyramids and early Mesopotamian ziggurats — and fades in later periods. The pattern has a historical window, not a uniform spread across all of antiquity.
Part 1 closed with a teaser. We said we had one more result — one that addresses the strongest skeptical objection to everything above.
This is that result.
The Geography Problem
Here’s the objection, and it’s a good one.
The Great Circle passes through the Nile Valley. It passes through Mesopotamia. It runs near the Indus River. It crosses the Peruvian coast. These are some of the most fertile, most habitable corridors on the planet — places where humans have been building things for thousands of years. Of course you find ancient sites along a line that threads through major river valleys and coastlines. You’d find ancient sites along any line drawn through those regions. The pattern isn’t about the circle. It’s about geography.
This is the strongest counter-argument to our findings, and we take it seriously. To kill it — or to be killed by it — we needed a test that separates what the line attracts from where the line goes.
The logic is simple: if geography explains the Great Circle pattern, then everything humans built in those regions should cluster on the line. Not just pyramids and temples, but also farms, villages, ports, and mines. A river valley doesn’t care whether you’re building a tomb or a toolshed. If the Nile corridor is what’s driving this, Nile corridor settlements should appear on the line just as much as Nile corridor monuments.
If they don’t — if only the most ambitious construction projects cluster while ordinary settlements don’t — then geography alone can’t explain the pattern.
The Settlement Baseline Test
We used the Pleiades Gazetteer, a completely independent academic database maintained by classical historians with funding from the National Endowment for the Humanities. Over 34,000 sites across the ancient Mediterranean and Near East — zero overlap with the Megalithic Portal data from Part 1. Different contributors, different editorial standards, different geographic focus.
Pleiades classifies sites by function, which gave us exactly the tool we needed. We split the database into two groups:
Monumental sites — temples, sanctuaries, pyramids, amphitheaters, aqueducts, tombs, and similar structures. These are the kinds of sites that appear in the Great Circle pattern: large-scale construction projects requiring significant labor, planning, and ambition.
Settlements — villages, farms, towns, ports, quarries, mines, bridges. These are the sites most tightly constrained by geography. You put your farm where the soil is good. You put your port where the harbor is. If geography drives the Great Circle pattern, these should cluster on the line at least as much as monuments — probably more, because settlements are more geographically determined than temples.
We ran the same distribution-matched Monte Carlo analysis on each group independently. Same methodology, same 200-trial baseline, same 50 km threshold. The only variable is what kind of site we’re counting.
Monte Carlo simulation is a way of asking "what would happen by chance?" You generate thousands of random scenarios that preserve the basic structure of your data — in our case, where archaeological sites tend to be located — and then check whether the real pattern stands out from the random ones. If the real result is far outside anything the random trials produce, it's probably not a coincidence.
All periods
Across all time periods in Pleiades:
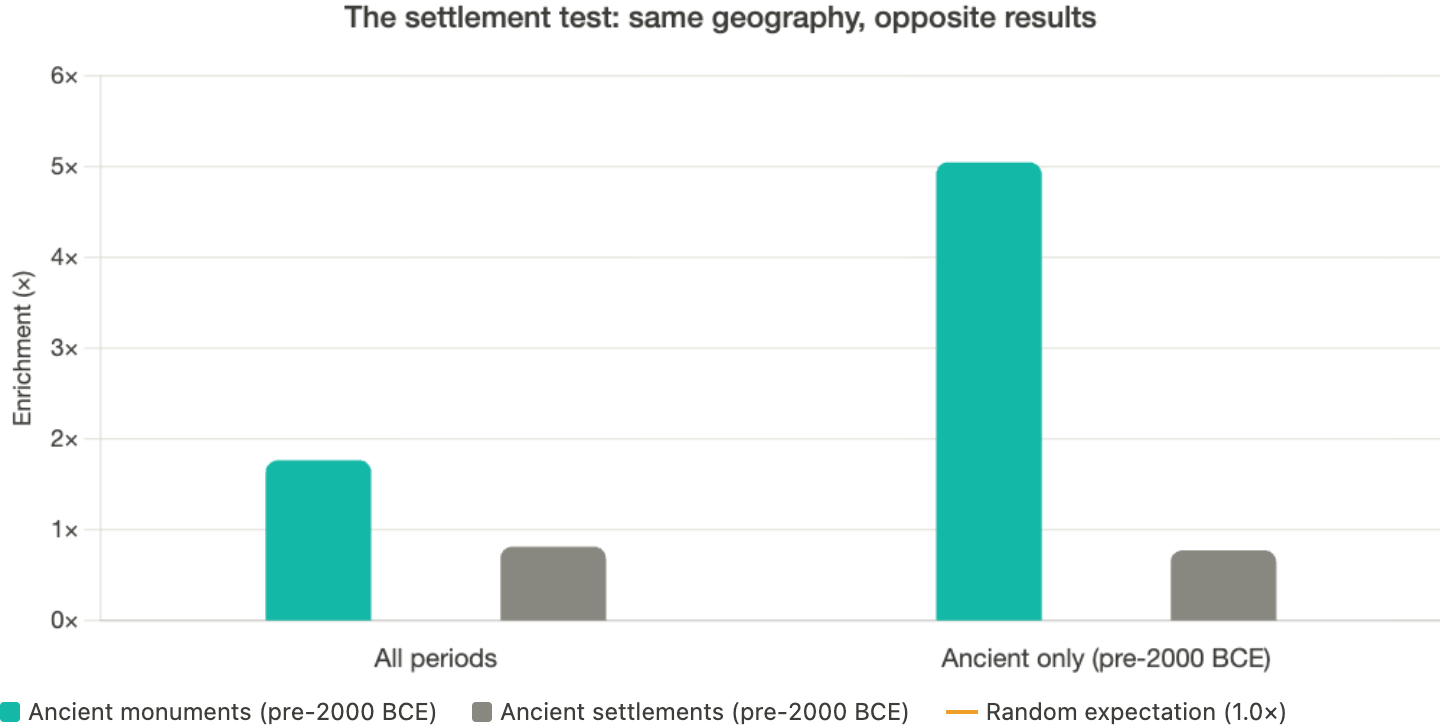
4,598 monumental sites — 83 fall within 50 km of the Great Circle, versus 47 expected. That’s a 1.77× enrichment, Z = 5.12.
18,037 settlement sites — 118 fall within 50 km, versus 145 expected. That’s a 0.82× enrichment, Z = −2.24.
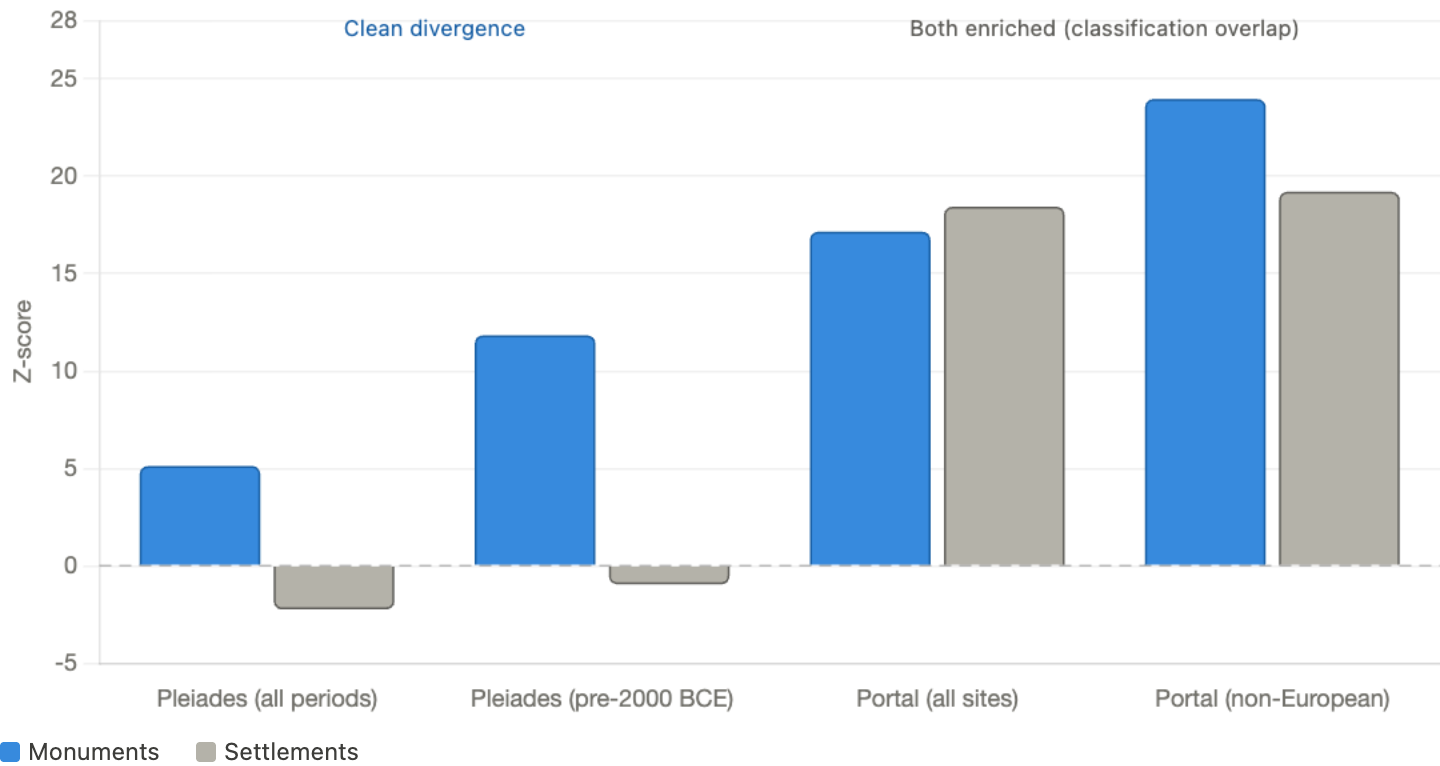
Monuments cluster above random. Settlements cluster below random. Same geography. Opposite result.
That alone is striking. But the all-periods numbers include medieval churches, Roman amphitheaters, and other later construction that Part 1 already showed carries a weaker signal. The Great Circle effect is strongest on the oldest sites. So the real test is filtering to the ancient world.
Ancient only (pre-2000 BCE)
When we filter to the oldest sites in Pleiades, sites dated before 2000 BCE, contemporary with the earliest monumental construction at Giza, Sumer, and the Indus Valley — the gap becomes enormous:
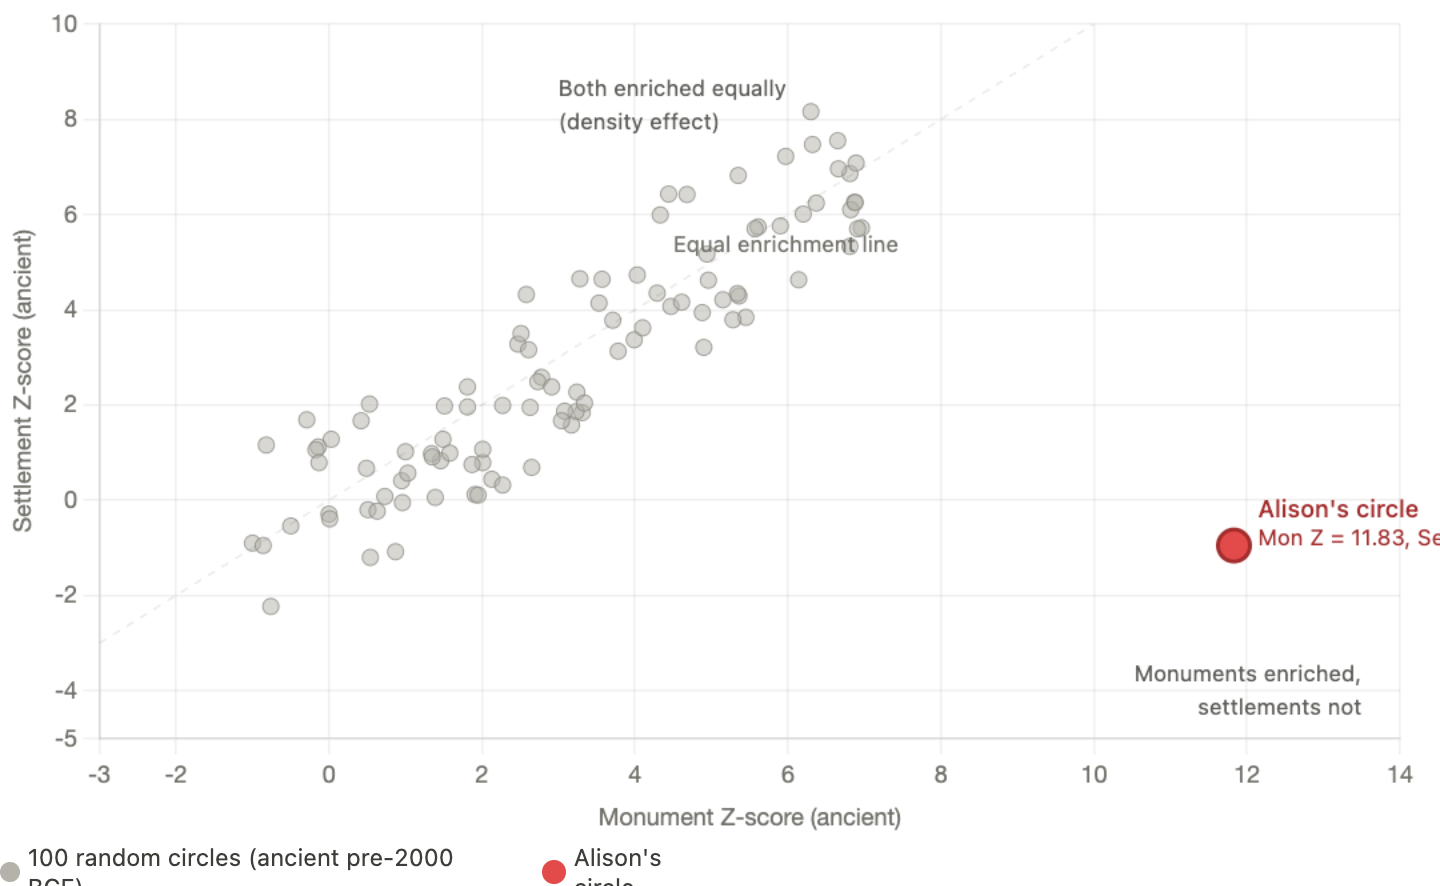
1,853 ancient monumental sites — 97 fall within 50 km. Expected: 7.0. That’s 5.05× enrichment, Z = 11.83.
4,141 ancient settlement sites — 14 fall within 50 km. Expected: 17.9. That’s 0.78× enrichment, Z = −0.95.
Read those numbers again.
Ancient monuments appear on the Great Circle at five times the expected rate. Ancient settlements — occupying the exact same regions, the exact same river valleys, the exact same time period — appear at less than the expected rate.
The gap between them: 9.98 Z-unit
The monument signal is nearly 10 standard deviations above the settlement signal. If geography explained the pattern, they’d be roughly equal. Instead there’s a chasm between them — monuments cluster dramatically on the line while settlements in the same regions don’t.
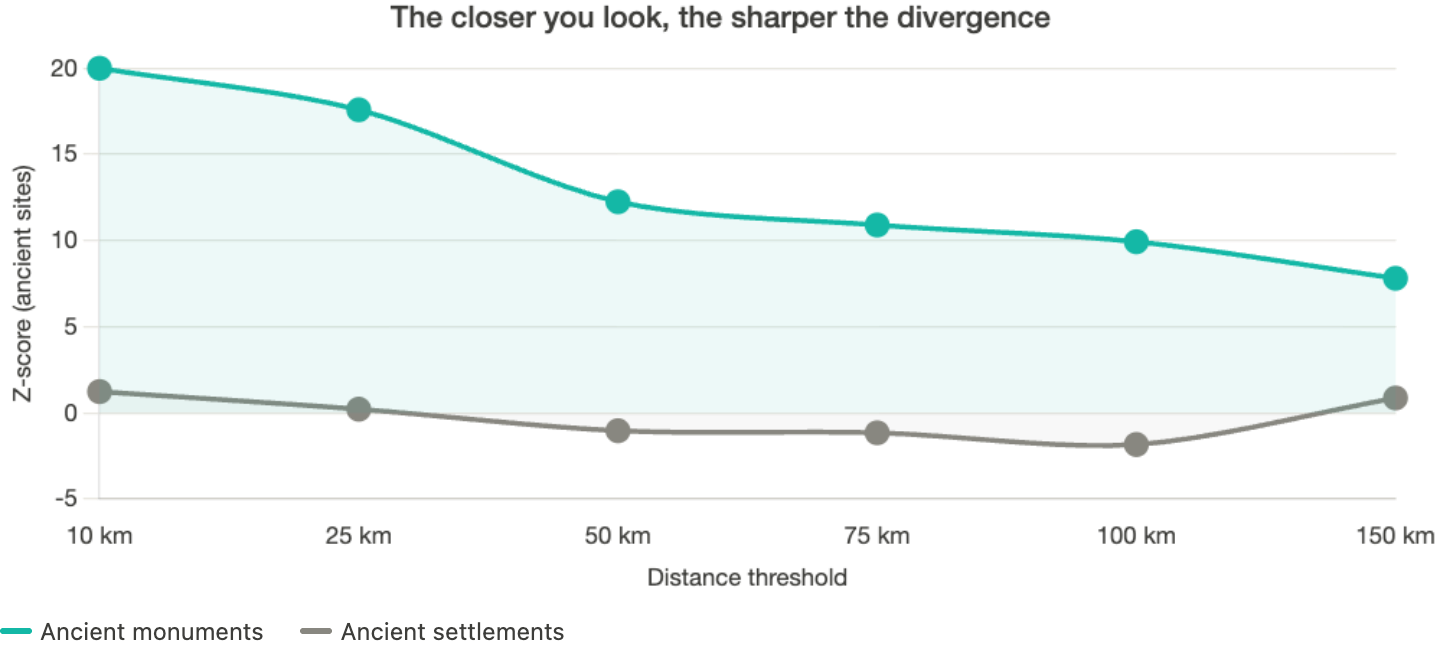
The divergence is actually strongest at the narrowest thresholds — at 10 km, the gap between monuments and settlements is even wider. The signal sharpens the closer you look, which is exactly the spatial signature of a genuine linear feature. Our multi-scale enrichment analysis confirms this: peak significance is at 10–20 km, not 50 km. Settlements never reach significance at any scale.
The temporal precision makes this even harder to explain by geography. When we broke the Pleiades data into millennia, the signal doesn’t spread evenly across antiquity — it spikes in a single millennium: 3000–2000 BCE. Before that: nothing. After that: it collapses. The Nile Valley was fertile in 5000 BCE. It was fertile in 1000 BCE. But only the 3000–2000 BCE construction — the era of the Giza pyramids, early Mesopotamian ziggurats, and the founding of the Indus Valley cities — clusters on this line. Geography doesn’t turn on in one millennium and off in the next.
This isn’t geography. Geography doesn’t select for ambition. Whatever is driving this pattern, it is specific to the most monumental construction projects of the ancient world. Villages and farms in the same valleys, drinking from the same rivers, don’t show it.
An honest complication
When we ran a similar monument-vs-settlement test within the Megalithic Portal itself — the primary dataset from Part 1 — both monuments and settlements showed enrichment on the line. Monuments scored Z = 17.15; settlements scored Z = 18.43.
Why the discrepancy with Pleiades? We think it comes down to classification precision. The Portal’s settlement category is labeled “Ancient Village or Settlement” — a single broad bucket that likely includes sites Pleiades would classify as monumental. A Peruvian ceremonial center or a Negev matsevot field might get tagged “village or settlement” in the Portal but “sanctuary” or “monument” in Pleiades. When we restrict to non-European Portal sites (the only ones near the Great Circle), monuments do score higher: Z = 23.96 vs Z = 19.20 for settlements. Directionally consistent, but not the clean separation Pleiades shows.
We consider the Pleiades test more diagnostic: it has 18,037 settlement sites vs the Portal’s 5,315, it uses granular type classifications maintained by academic historians, and it’s completely independent from the primary dataset. But we’re reporting both results because hiding an inconvenient number is the fastest way to lose credibility.
No other circle does this
To test whether this monument-specific enrichment might be a generic property of great circles — something any circle through populated regions would produce — we ran the same monument-versus-settlement test on 10,000 random great circles.
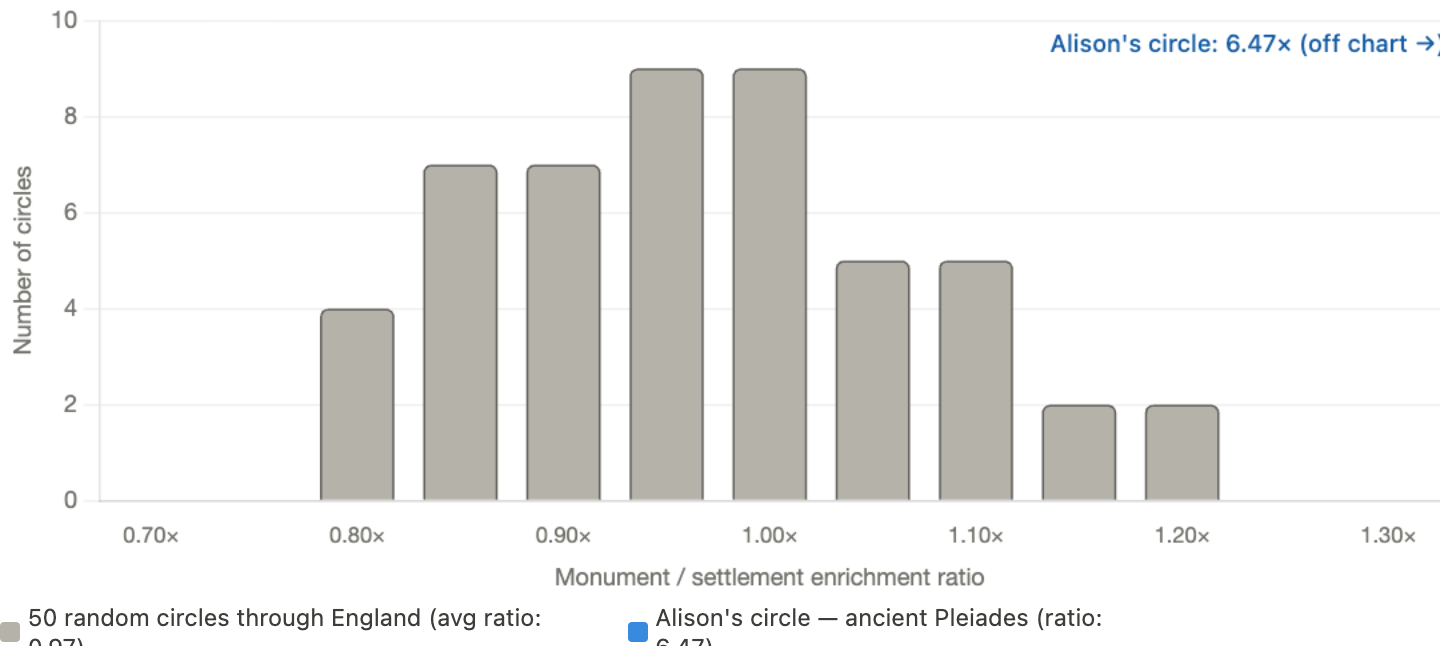
For ancient sites (pre-2000 BCE), zero of 10,000 random circles matched Alison's monument-settlement divergence. The random distribution has mean = 0.00 and std = 0.07; the maximum random divergence was 0.90. Alison's is 9.91. That puts it at the 100th percentile for monument-specific enrichment. No random great circle, not even the ones that score far higher on total site count by threading through the UK and France, produces the same ancient monument-specific enrichment.
We also tested 4,323 habitability-matched circles — circles through equally populated corridors. Only 16 (0.37%) produced comparable divergence. The monument-settlement split isn't explained by the circle passing through populated areas.
This is not a property of great circles in general. It is a property of this circle.
As a negative control, we tested the Great Circle against 20,000 professionally classified English scheduled monuments from Historic England's National Heritage List. The circle doesn't pass through England. Result: zero sites within 500 km. Monument Z = 0.0, settlement Z = 0.0, divergence = 0.0. Signal where expected, null where expected.
A statistical test is only as trustworthy as its ability to produce a null result when there’s nothing to find. If our methodology showed significant results everywhere — even in regions the circle doesn’t pass through — it would mean the method itself is flawed. So we ran it on a dataset where we know the answer should be zero.
The Database Bias Question
Part 1 noted that Alison’s circle ranks at the 96th percentile among 1,000 randomly generated great circles. We tested 100,000 random great circles. About 80-96% score fewer sites than Alison’s — but the ones that beat it ALL pass through the UK and France, where 65% of the database lives. Among the 1,718 random circles that share Alison’s geographic profile — passing through the Middle East and South America without touching Europe — it ranks #1.
The raw leaderboard is dominated by circles gaming the database’s European concentration. Alison’s circle is doing something different: scoring high entirely from non-European sites in a database that is 65% European.
That distinction matters. Are there circles that score even higher on raw site count?
Yes — and they all cheat.
Every one of the top 10 random circles scores between 6,500 and 8,400 sites by passing through the United Kingdom and France, where 65% of the Megalithic Portal’s data lives. They exploit the database’s built-in geographic concentration. Alison’s circle scores 319 sites while passing through zero European territory. It threads the Middle East, South Asia, East Asia, South America, and Oceania — the exact regions the database was never designed to cover well.
Among the 839 random circles that, like Alison’s, avoid Europe entirely, only 9.2% match its site count. The signal isn’t coming from where the data is dense. It’s coming from where the data is sparse.
A European volunteer database, built to catalog European megaliths, independently confirms a pattern running through Egypt, Peru, Iran, and Pakistan. That’s not database bias. Think about what database bias would actually look like. If the Megalithic Portal's heavy European coverage were creating a false pattern, the signal would be strongest in Europe — where the data is densest. Instead, the circle avoids Europe entirely, and the signal comes from Egypt, Peru, Iran, and Pakistan — the exact regions the database covers least well. A database that's 65% European is independently confirming a pattern that has nothing to do with Europe. That's the opposite of bias. Bias would pull the signal toward the data. This signal appears despite the data working against it.
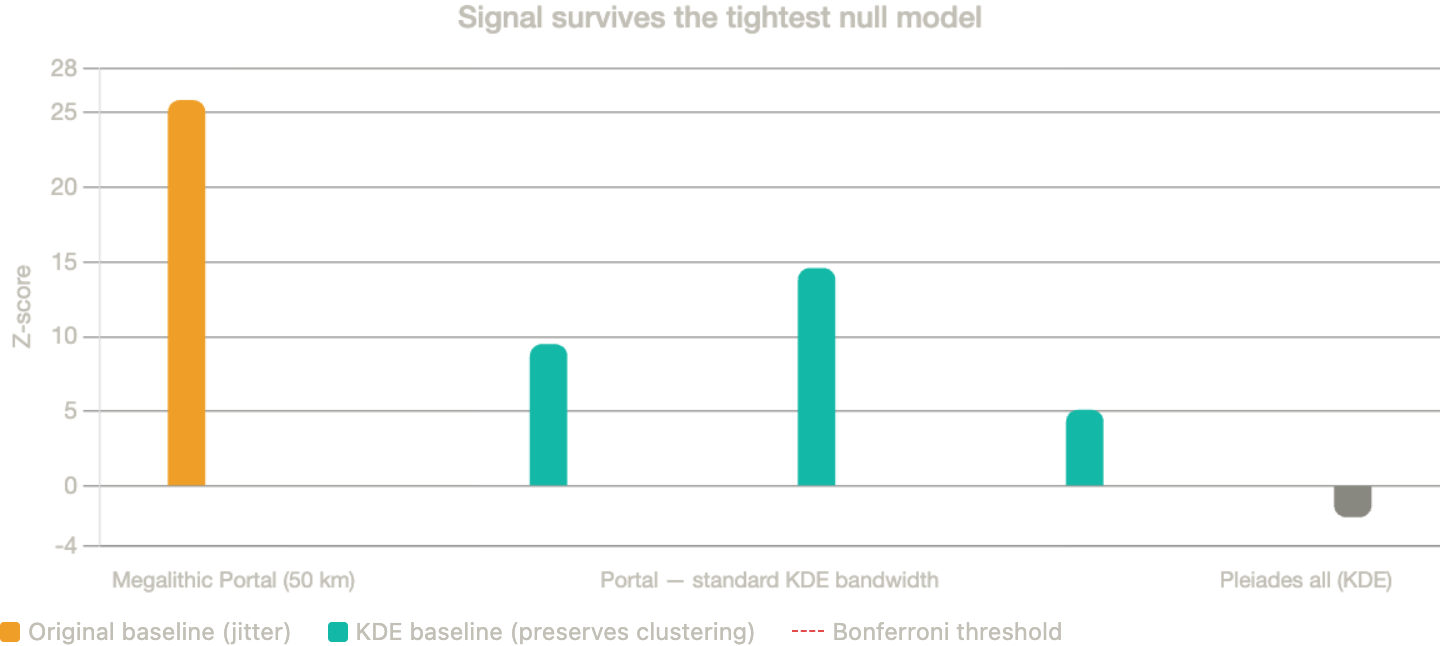
Surviving the Tighter Baseline
Part 1 used a distribution-matched Monte Carlo to compute significance — shuffling site coordinates independently to build a null expectation. A statistician might object that this null model is too loose: it preserves where sites are distributed by latitude and longitude separately, but destroys the joint clustering. The Nile Valley is a dense clump of sites. So is coastal Peru. An independent shuffle breaks those clumps apart, potentially underestimating how many sites a circle through those regions would catch by chance.
To address this, we replaced our original baseline with a kernel density estimation (KDE) model — a smooth probability surface fitted to the actual site distribution that preserves geographic clustering. Points sampled from this surface stay clumped in the Nile Valley, stay clumped in Peru, but shift positions enough to test whether the Great Circle captures more than expected.
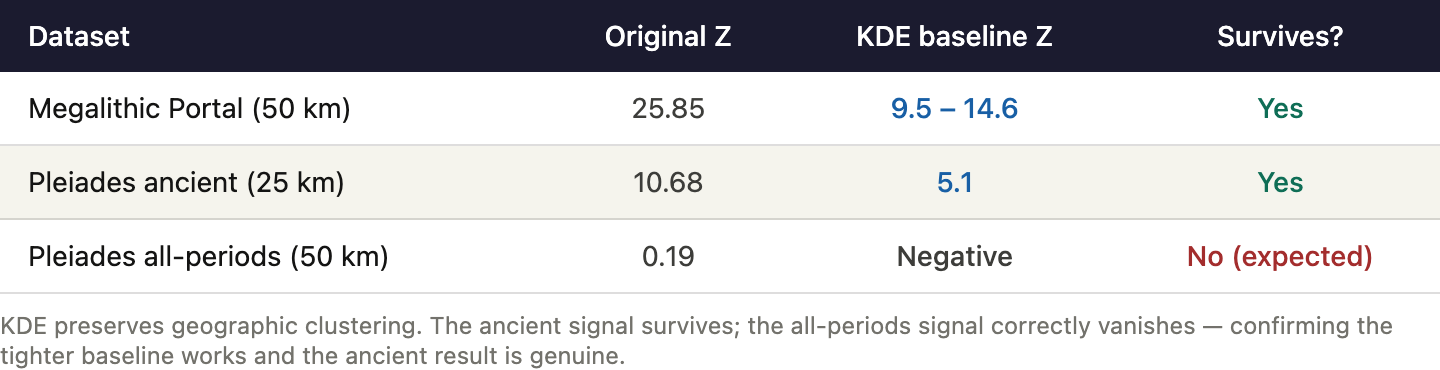
The signal survives. Against the tightest KDE baseline we could construct, the Megalithic Portal still shows Z = 9.5 at 50 km. At the standard bandwidth, Z = 14.6. On Pleiades ancient sites (pre-2000 BCE), Z = 5.1. These are lower than the original Z-scores — the tighter baseline correctly removes some of the geographic inflation — but they remain far beyond any conventional threshold for statistical significance.
One revealing detail: Pleiades all-periods sites, which span the entire Greco-Roman world, show negative Z-scores against the KDE baseline. The circle passes through the Mediterranean, and the KDE model knows that’s where Pleiades sites are dense. It correctly identifies the all-periods enrichment as geographic. But the ancient Pleiades subset — pre-2000 BCE sites only — still clusters significantly on the line even after the geographic correction. The signal is real, it’s ancient, and it survives the tightest reasonable test we can throw at it.
We also ran a habitability-adjusted analysis comparing the circle only against circles through equally populated corridors. The overall site count is not significant — the circle passes through habitable terrain and that explains the aggregate count. But the monument-settlement divergence survives: 99.63rd percentile among habitability-matched circles. Geography explains why sites are there. It doesn't explain what kind of sites are there.
It’s Not Geology Either
We investigated whether the Great Circle corresponds to any known geophysical feature — a plate boundary, a magnetic lineament, a geoid anomaly, a mantle plume track. It doesn’t. The circle’s path doesn’t systematically follow any geological structure along its 40,000 km circumference. The ~30° tilt from the equator is pure geometry (90° minus the pole’s latitude), not a geophysical constant.
The pole itself sits in southeastern Alaska, in the Yakutat microplate collision zone — one of Earth’s most tectonically active spots. But any great circle has to have a pole somewhere, and the Pacific Rim has a lot of tectonically active spots. The pole is approximately 444 km from Hapgood’s proposed “Yukon pole” — close enough to notice, far enough that it isn’t a match, and Hapgood’s crustal displacement hypothesis is rejected by mainstream geophysics regardless.
Whatever explains the archaeological clustering, it isn’t geology.
We also tested whether the circle simply passes through historically high-population areas using HYDE 3.3 population density grids spanning 3000 BCE to 1000 CE. It does — at roughly 2× the average — but this falls well within random variation (Z = 0.89, not significant) and cannot account for the 3.6–5.0× monument enrichment or the monument-settlement divergence.
What’s Underneath
The settlement test tells us the Great Circle pattern is real and not a geographic artifact. The geology test eliminates geophysics as an explanation. So something about these specific locations drew the most ambitious construction projects of the ancient world — and we don’t know what.
That raises a question: are the visible monuments the full story? Or have these locations been significant for longer than we think — with earlier construction buried beneath what we can see?
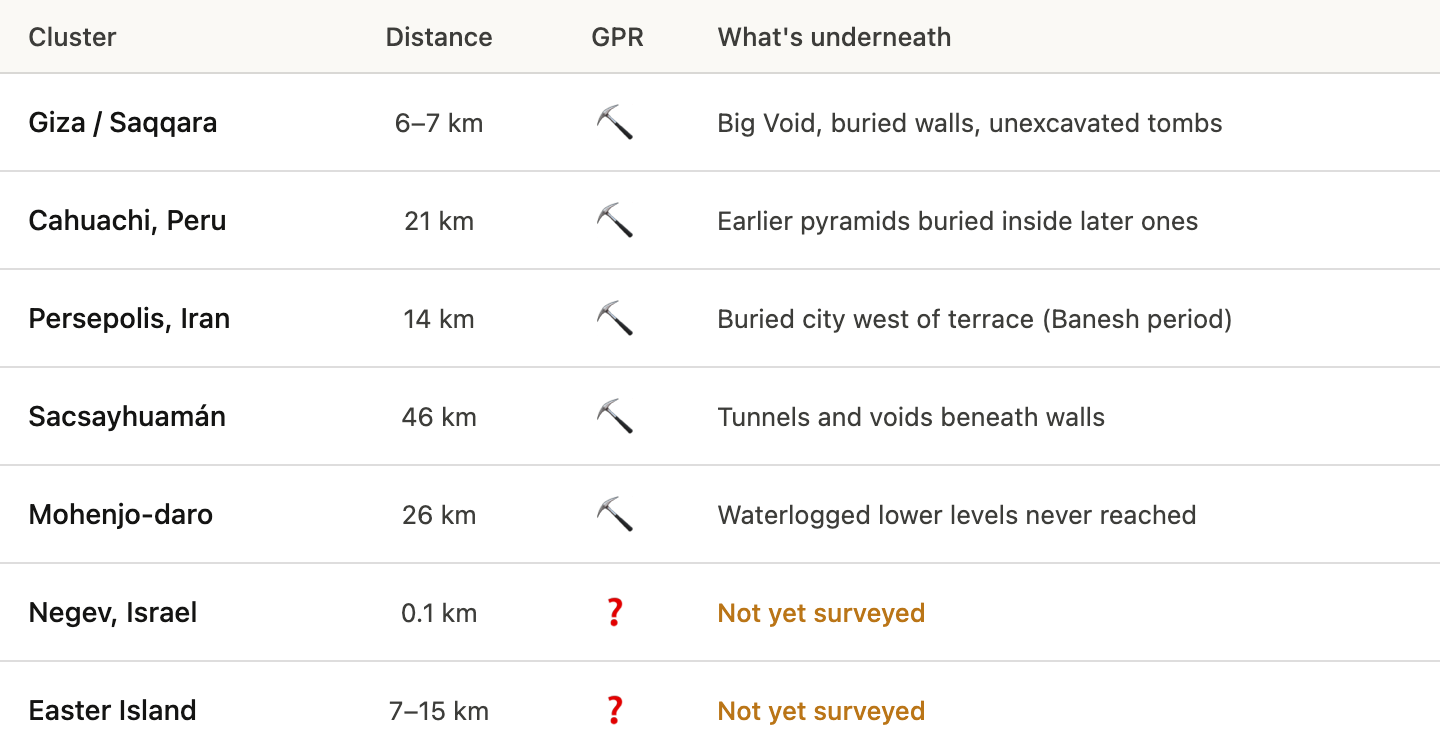
At five of six Great Circle clusters, scientists have already pointed instruments at the ground and found things they haven’t dug up yet. Nobody has connected these findings, because each site is studied by different teams in different countries, publishing in different journals. Here’s what they’ve found.
Giza Plateau — 6.8 km from the line
In 2024, Sato and colleagues used ground-penetrating radar and electrical resistivity tomography to identify a large composite subsurface anomaly beneath the plateau — possible tombs or voids that have never been excavated. In 2021, Eid et al. detected a linear magnetic anomaly interpreted as a causeway extension, along with mud-brick walls and small cavities. Between 2015 and 2023, the ScanPyramids project used muon tomography — detecting cosmic-ray pBetween 2015 and 2023, the ScanPyramids project articles passing through the pyramid — to identify the “Big Void” above the Grand Gallery and a previously unknown corridor behind the north face chevrons.
Beneath the pyramid-era construction: Maadi culture remains dating to 3900 BCE, thirteen hundred years before the Great Pyramid.
Most of these anomalies remain unexcavated. The north-face corridor has only been probed by a small endoscope.

Saqqara — 6.4 km from the line
In 2025, El-khteeb and colleagues found buried walls, roads, and architectural remains beneath both the Greco-Roman and Old Kingdom levels — structures going down to 8 meters depth. The Polish-Egyptian archaeological project has documented sarcophagi, burial shafts, and mud-brick tombs extending beyond the mapped limits of the site.
Beneath the pyramids: 1st Dynasty mastabas dating to 3100 BCE.
Only a small fraction of the mapped anomalies have been excavated.

Cahuachi, Peru — 20.6 km from the line
Between 2008 and 2011, Lasaponara and colleagues used satellite imagery, GPR, and magnetometry to reveal multiple construction phases within the Piramide Naranjada at this Nazca ceremonial center. Earlier adobe structures are buried inside later pyramid mounds — older ritual construction beneath the visible surface.
Many internal anomalies remain untested.

Persepolis, Iran — 13.6 km from the line
What most people think of as Persepolis — the famous stone terrace with its carved reliefs and columned halls — is just the ceremonial heart of something much larger. Between 2003 and 2014, Iranian-French and Iranian-Italian joint archaeological missions used magnetometry surveys to map over 15 hectares of buried remains west and northwest of the terrace. What they found was an entire city: building foundations, streets, residential quarters, administrative complexes, and a drainage network stretching at least 6 km from the terrace toward the village of Fīrūzi. The settlement of Parsa — the Persian name for Persepolis — was not a single palace on a platform. It was a sprawling urban center, most of which has never been excavated.
Seven kilometers from the terrace: Tall-e Bakun, a settlement occupied since 5000 BCE — nearly 4,500 years before Darius began building. The Marvdasht Plain didn’t become important when the Achaemenids arrived. It had been drawing human settlement for millennia. Persepolis was built on top of a tradition, not at the start of one.

Sacsayhuamán, Peru — 46 km from the line
In January 2025, archaeologists Jorge Calero Flores and Mildred Fernández Palomino announced the confirmed discovery of the Chinkana — a 1,750-meter underground tunnel system connecting Sacsayhuamán to the Qorikancha (Temple of the Sun) in central Cusco. Using ground-penetrating radar and acoustic prospecting, the team mapped the main tunnel plus three branches, one leading to the circular tower site of Muyucmarca and another behind the Church of San Cristóbal. The researchers estimate up to 8 km of underground passages beneath Cusco.

Mohenjo-daro, Pakistan — 25.6 km from the line
One of the ancient world’s largest cities — 40,000 people, planned grid streets, sophisticated drainage — and roughly 80% of it remains unexcavated with the deepest levels never reached. Pakistan banned new excavations after 1965 because digging accelerated weathering and salt damage to the exposed brickwork.
The lower waterlogged levels, which would reveal what came before the urban grid, have never been reached. In 2022, catastrophic floods inundated the site; a UNESCO monitoring mission in 2024 prioritized conservation over further excavation.

The pattern
Five of six Great Circle clusters have documented subsurface anomalies. At every one of them, earlier construction phases or unexplored structures have been detected beneath visible monuments. The two clusters without systematic GPR — the Negev standing stone fields and Easter Island’s ahu platforms — simply haven’t been properly surveyed.
Think about what this means. The statistical signal we measured in Part 1 is based entirely on visible monuments — what’s on the surface. At every cluster where scientists have looked underground, they’ve found more. Earlier construction. Unexplored chambers. Buried cities. The visible archaeological record at these sites is not the full story. It may not even be most of the story.
And if the subsurface record is deeper and older than what’s on the surface, the Great Circle alignment may be deeper and older too.
The Persian Gulf Was a River Valley
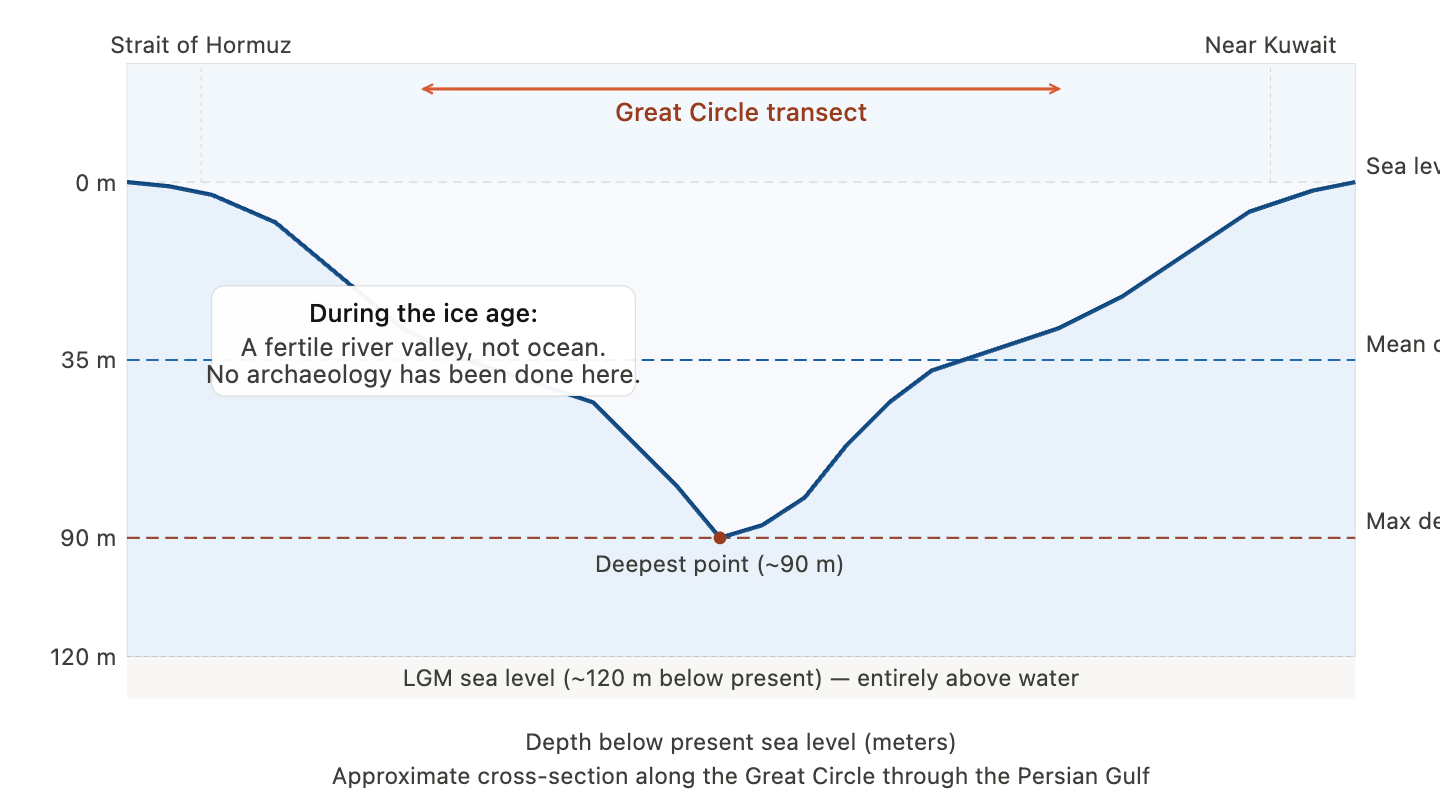
The Great Circle crosses the Persian Gulf. Today, that’s a body of water. Twenty thousand years ago, it was dry land.
During the Last Glacial Maximum — roughly 26,000 to 20,000 years ago — global sea levels were about 120 meters lower than they are today. The Persian Gulf has a mean depth of just 35 meters, with a maximum of about 90 meters along the Great Circle’s path. It was entirely above water. Not a narrow coastal shelf — the whole thing.
In 2010, archaeologist Jeffrey Rose proposed the “Gulf Oasis hypothesis”: that the dry Gulf basin was a fertile river valley fed by the Tigris-Euphrates system, with freshwater lakes and habitable conditions. Not a barren desert shelf — a lush lowland valley the size of Great Britain, wetter and more temperate than the surrounding highlands, sitting between what would later become two of the world’s earliest civilizations: Mesopotamia to the northwest and the Indus Valley to the east.
The Great Circle passes directly through the northern basin of this valley, entering near the Strait of Hormuz and exiting near Kuwait.
No underwater archaeology has been conducted in the basin interior along this path. None.
The Persian Gulf is shallow enough to survey with existing technology. ROVs, side-scan sonar, and marine GPR can all operate at 35-meter depths. The barrier isn’t technical — it’s that nobody has looked, because nobody has connected the dots between what Rose proposed and where the Great Circle goes.
Four Civilizations Connected on Dry Land
Here’s where the Gulf becomes part of a larger picture.
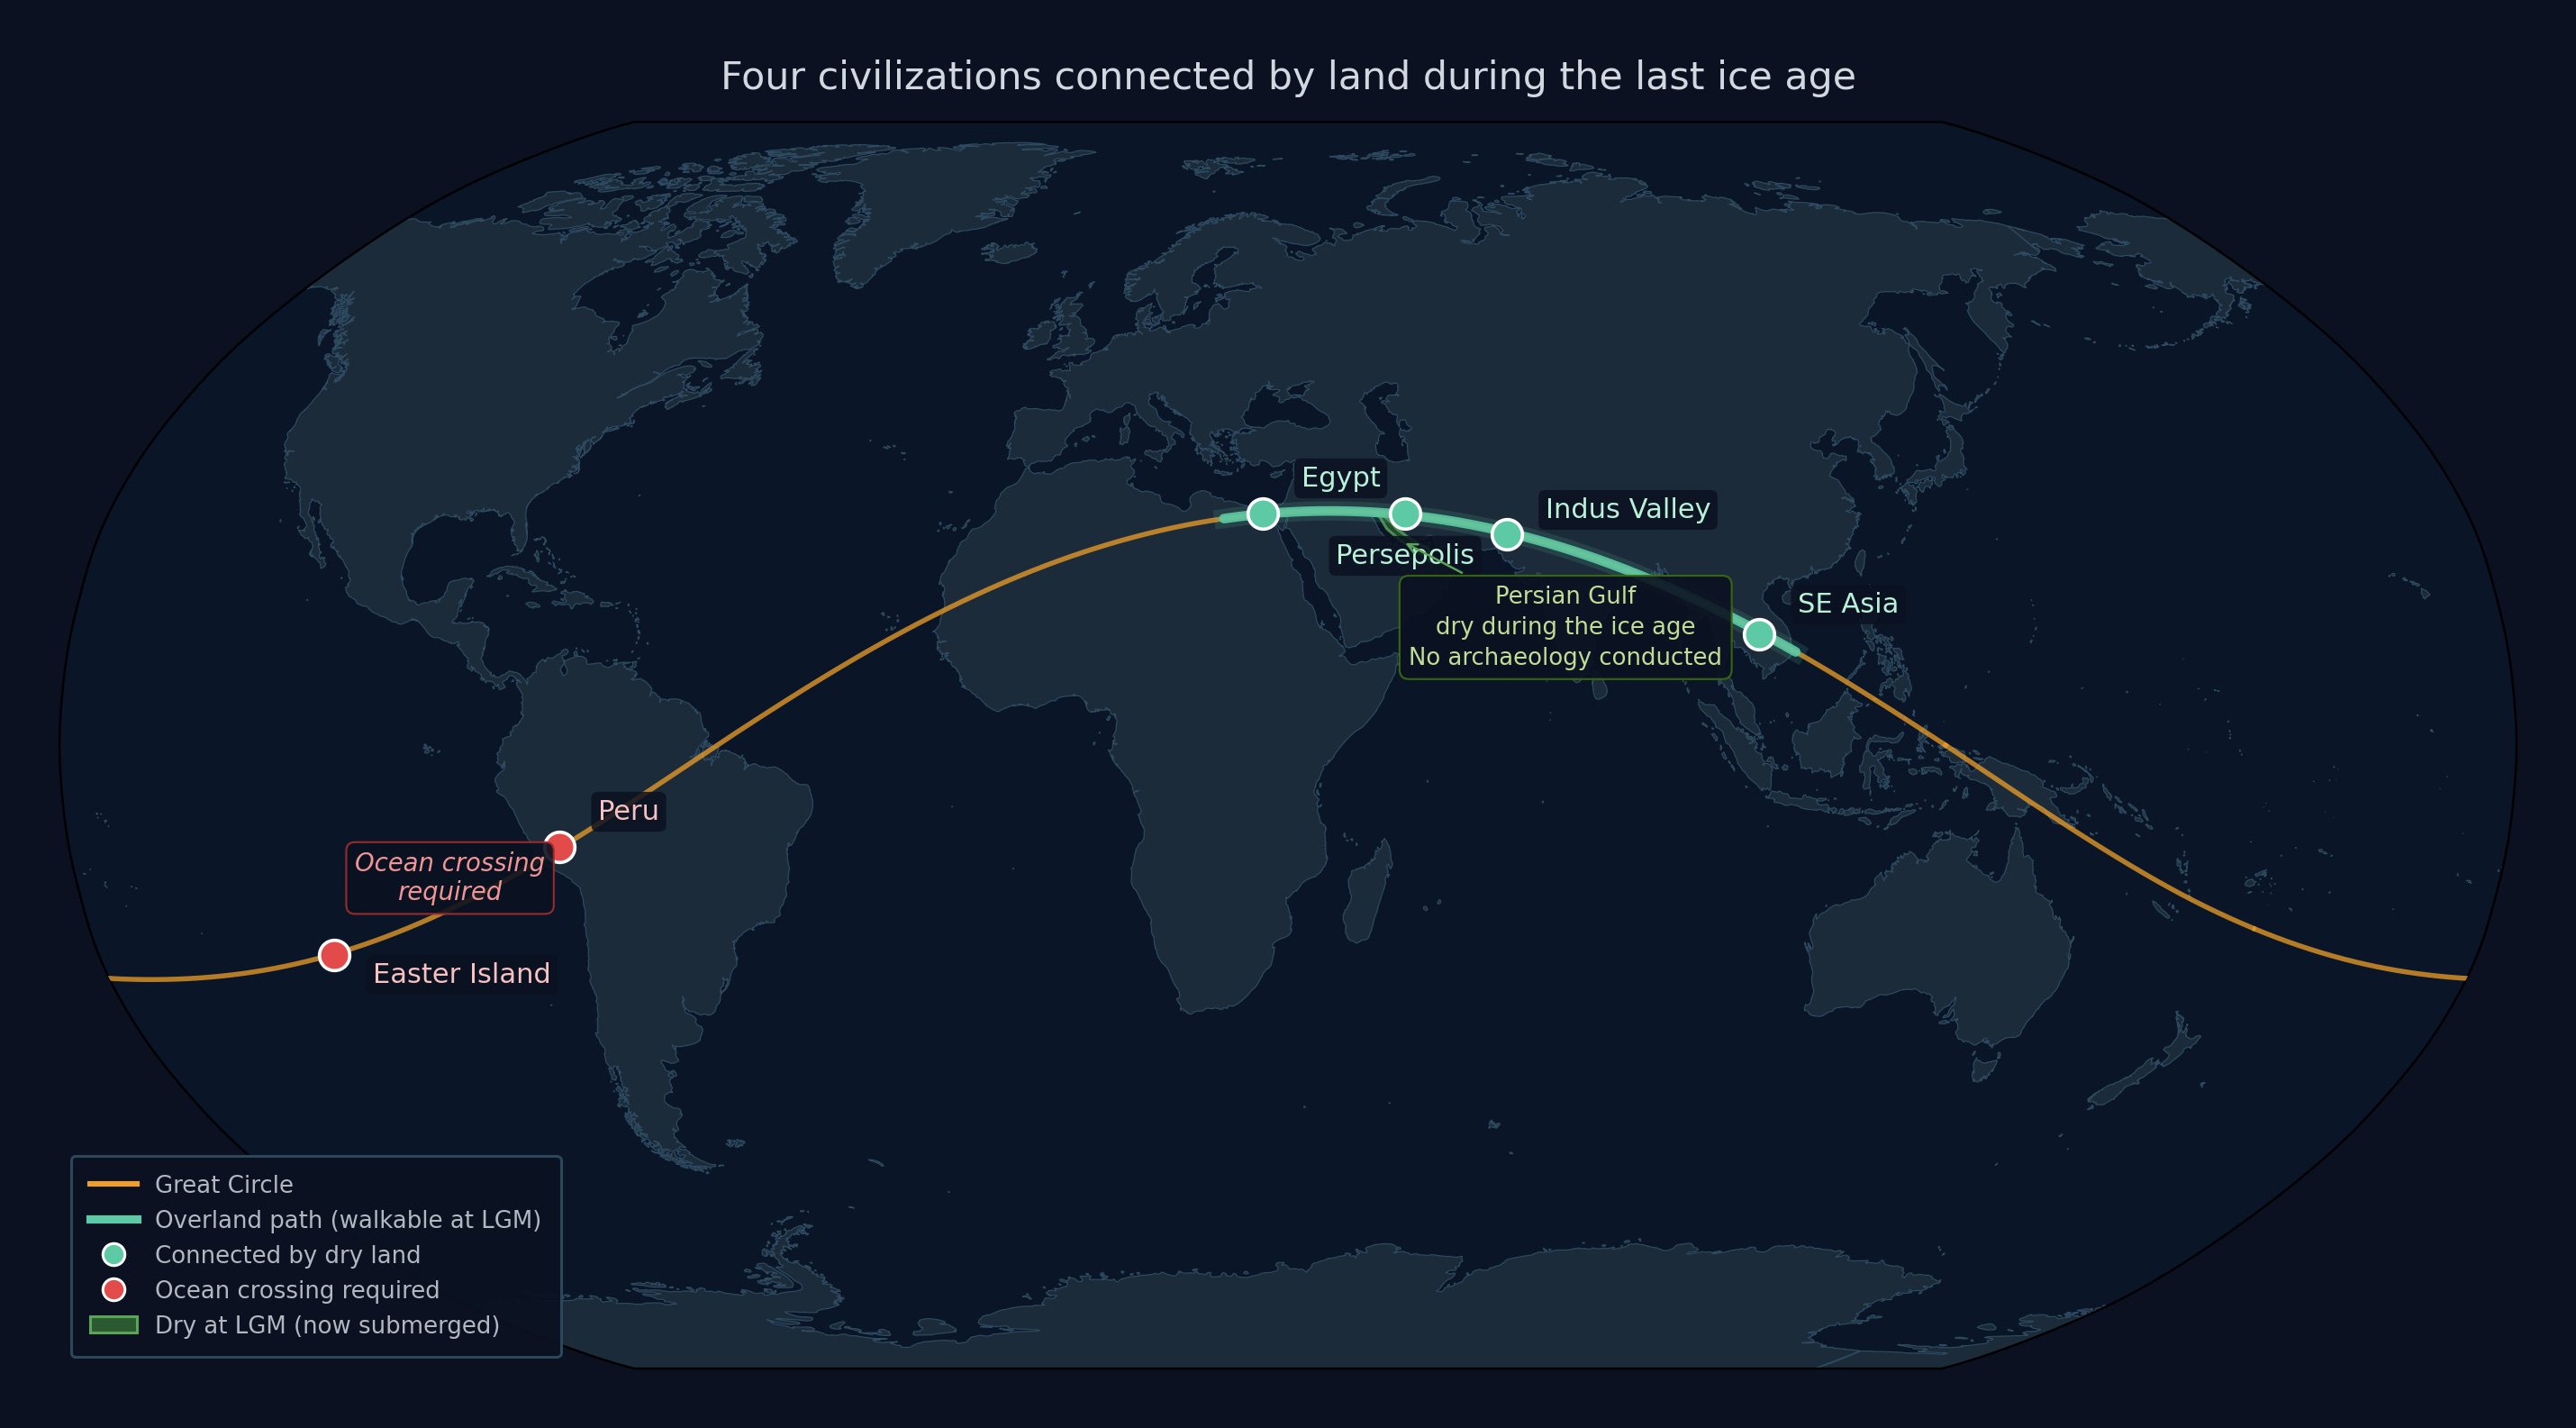
During the Last Glacial Maximum, you could have walked from the Negev standing stones through the dry Persian Gulf to Persepolis. You could have continued overland to Mohenjo-daro. From there, you could have crossed mainland Southeast Asia — through what is now Cambodia, Thailand, Myanmar — to the sites at the far end of the Great Circle’s arc. Four of six Great Circle clusters, connected by one unbroken overland path, all on dry land.
The circle does not cross the Gulf of Thailand, as some earlier sources claimed. It crosses mainland Southeast Asia and then the South China Sea. Parts of the Sunda Shelf near Vietnam and Borneo were also exposed at the LGM, adding additional dry land to the route.
In total, roughly 28 of the 165 ocean degrees along the Great Circle — about 17% — were walkable during the ice age. The continuous dry-land path runs: Egypt → Levant → Persian Gulf (dry) → Iran → Indus Valley → mainland Southeast Asia.
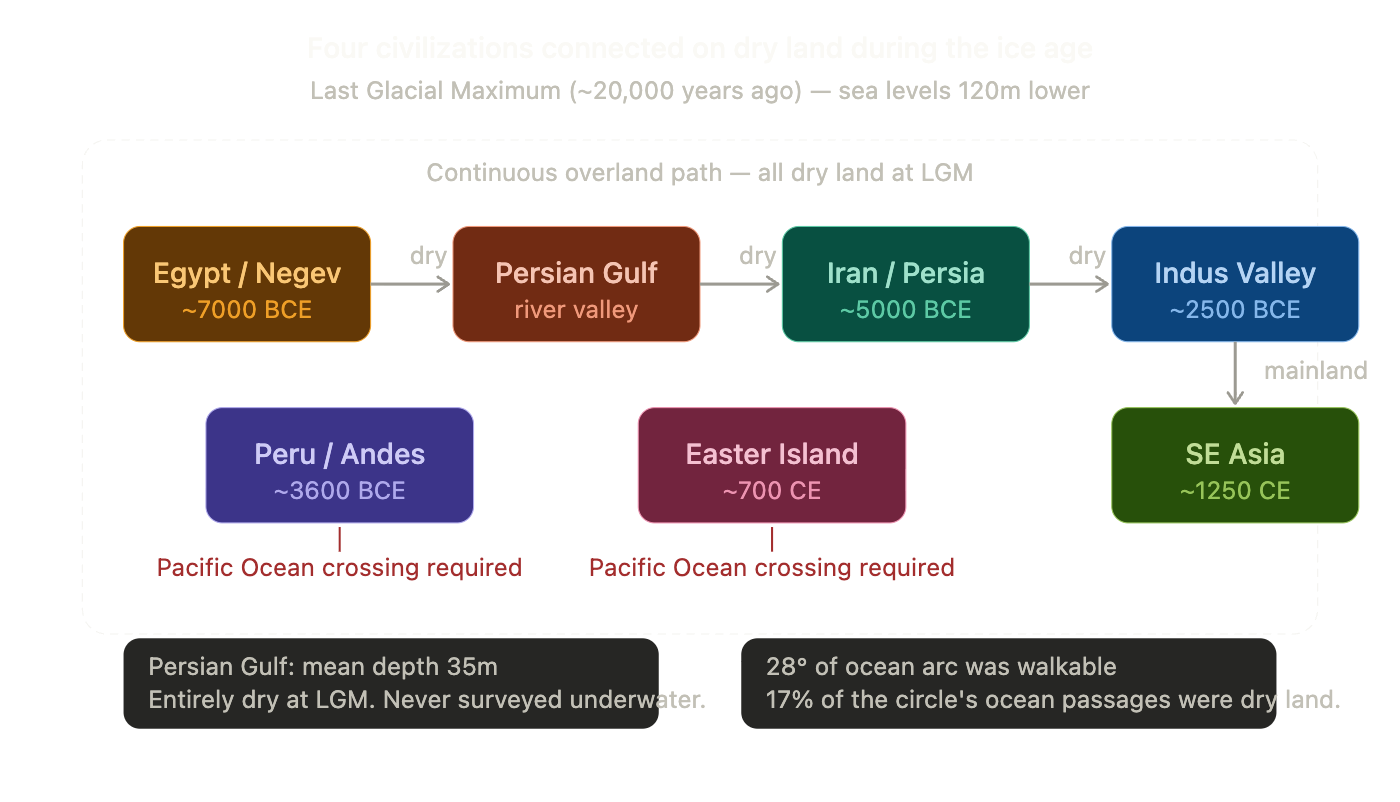
The two clusters not connected by this path are Peru and Easter Island. Both require Pacific Ocean crossings — then and now.
We’re not claiming anyone actually walked this path. We don’t have footprints or waypoints. We’re saying the physical geography made it possible — and that four independent centers of ancient monumental construction happen to fall along a route that was continuously connected by dry land during the last ice age. That’s a geographic fact, not an interpretation. What to make of it is an open question.
It’s also worth noting what the walkable path doesn’t connect. The two most isolated clusters — Peru and Easter Island — are the two that require deep Pacific crossings. Easter Island is surrounded by thousands of kilometers of open ocean in every direction. Peru’s Pacific coast drops steeply off the continental shelf. If you wanted to argue that the Old World clusters reflect some kind of overland tradition, the data is consistent with that. But the New World clusters require a different explanation — or a very different level of maritime capability.
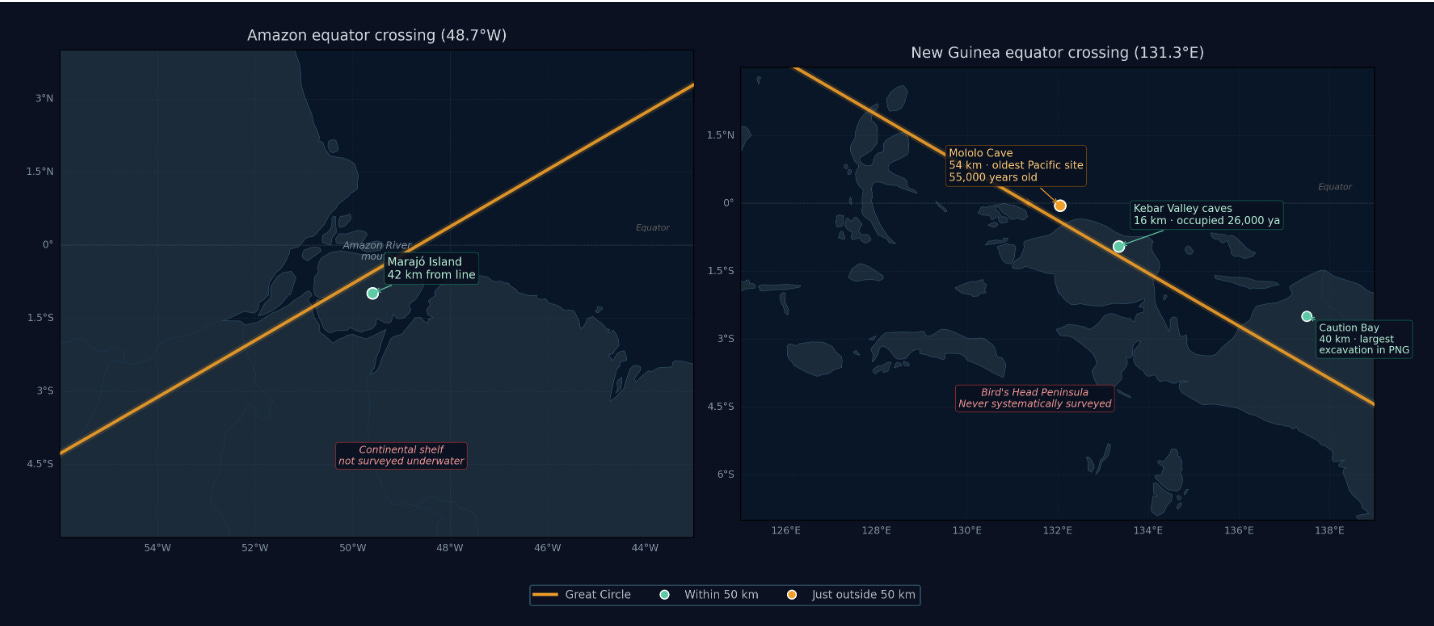
At the equator, the Great Circle crosses land twice: once near the mouth of the Amazon (48.7°W) and once near northwest New Guinea (131.3°E). Both crossings sit on continental shelves that were exposed during the ice age. Neither has been surveyed underwater.
At the Amazon crossing, we found a new hit: Marajó Island, home of the Marajoara mound-building culture (400–1400 CE, population estimated at 100,000+), sits just 42 km from the Great Circle. At the New Guinea crossing, we found three significant sites: Kebar Valley caves (16 km from the line, occupied 26,000 years ago), Caution Bay (40 km, the largest archaeological excavation in PNG), and Mololo Cave — the oldest site in the Pacific at 55,000 years — just outside the 50 km threshold at 54 km. The region remains one of the least archaeologically surveyed on Earth. These three sites were found with minimal searching. Systematic survey of the Bird’s Head Peninsula, where the circle crosses New Guinea, has never been conducted.
Alison noted in 2001 that the circle crosses several largely unexplored regions — the Sahara, the Brazilian Amazon, the highlands of New Guinea, and underwater continental shelves. Twenty-five years later, we surveyed each of these corridors and found archaeological sites at every one.
What the Line Misses
The honest reporting of what the Great Circle doesn’t hit is what makes the hits credible. So here are the misses.
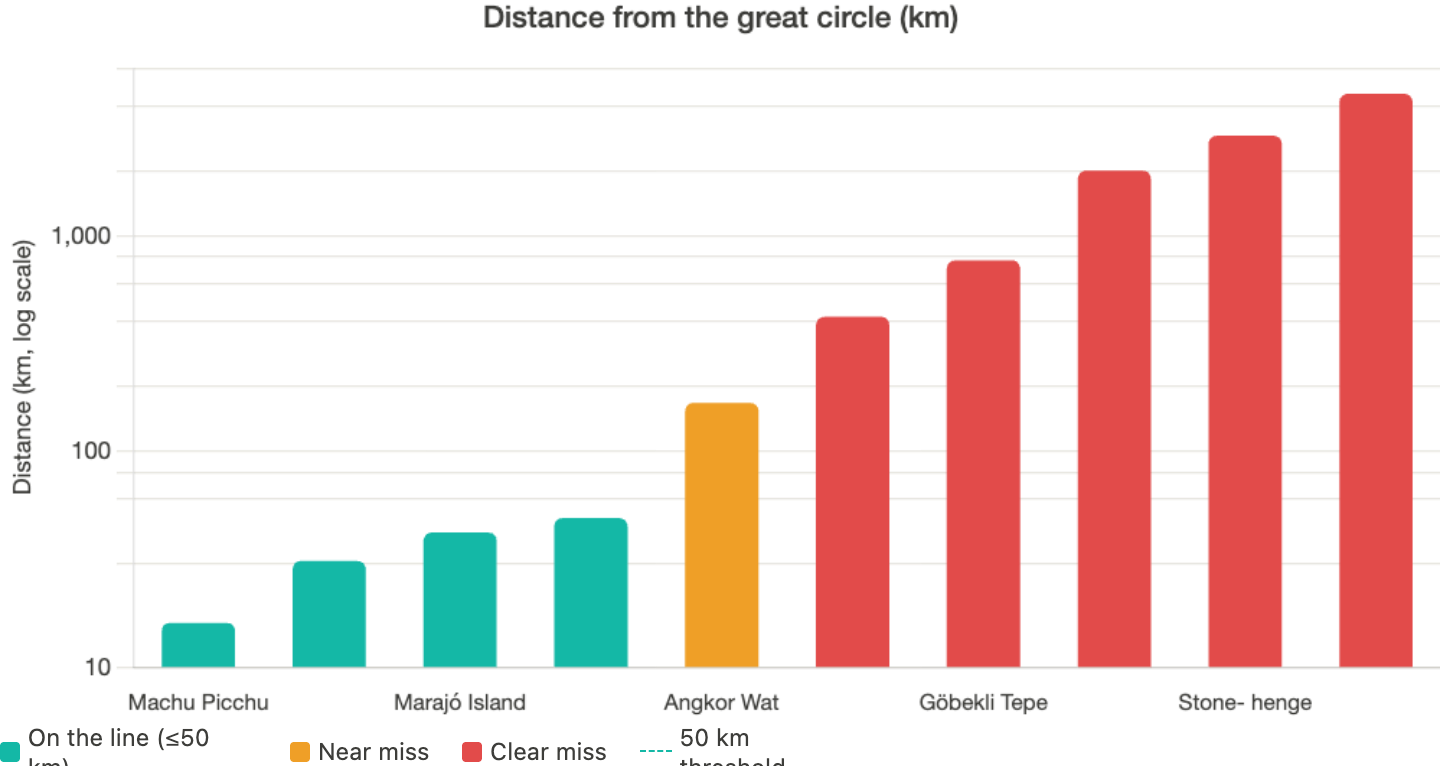
Göbekli Tepe — 770 km. The oldest monumental construction on Earth is not on the Great Circle. We referenced it in Part 1 as an example of how timelines change when you dig deeper — not as a site on the alignment. It isn’t.
Stonehenge — 2,915 km. The world’s most famous megalithic monument is nowhere near the line. The Great Circle doesn’t pass through Europe at all — which, as we showed above, is precisely why the signal is so striking.
Teotihuacan — 4,559 km. The Great Circle doesn’t pass through Mesoamerica. Two of six recognized cradles of civilization — China and Mesoamerica — are completely off the line. We’ve said this from Part 1. The pattern is real, but it’s not universal.
Baalbek — 421 km. Gunung Padang — 2,006 km. Both clear misses. The circle doesn’t pass through the Levant or Java.
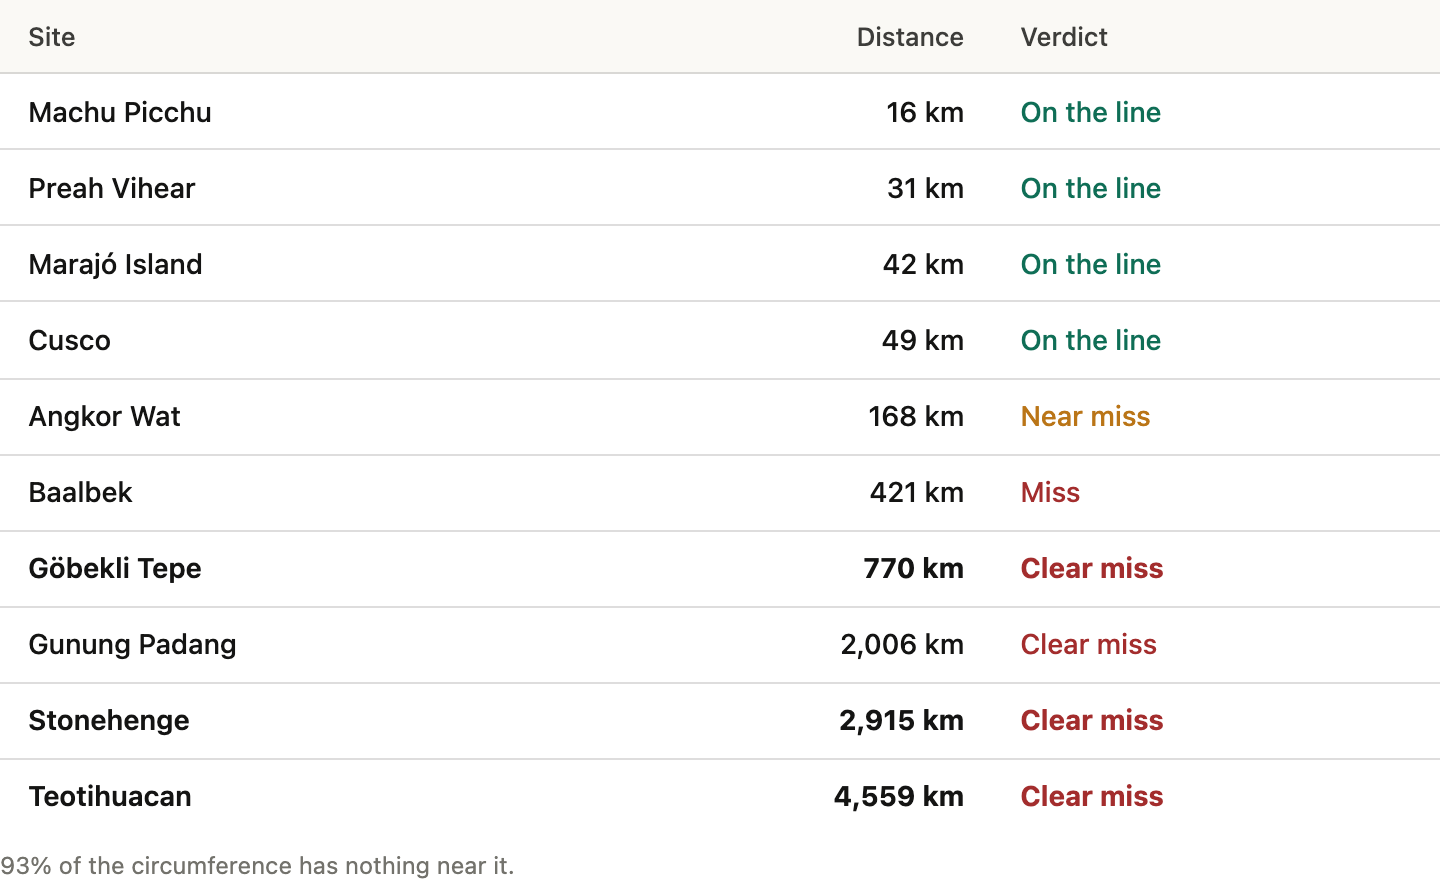
Angkor Wat — 168 km. A near miss. But Preah Vihear — a related Khmer temple 90 miles to the northeast, built by the same empire that would later build Angkor — is on the line at 31 km. The circle passes through the Khmer civilization’s territory, just not through its most famous monument.
And some hits that haven’t been previously highlighted:
Machu Picchu — 16 km. One of the most famous ancient sites on Earth, squarely on the Great Circle.

Cusco — 49 km. The Inca capital, right at the 50 km boundary.

Marajó Island — 42 km. A major pre-Columbian mound-building culture at the exact point where the Great Circle crosses the equator. New to this analysis.
Further along the circle’s path through Brazil, two archaeological sites in the Tapajós River region — including the Sítio Arqueológico de Santarenzinho — sit within 1 km of the line. The Tapajós valley has over 375 documented archaeological sites with Amazonian Dark Earth deposits showing thousands of years of pre-Columbian habitation.
The circle passes near zero sites for about 93% of its circumference. It’s mostly ocean and empty desert. The clustering happens in tight, discrete nodes — and the nodes that exist are among the most archaeologically significant locations on Earth.
Where This Leaves Us
Let’s review what we’ve covered:
Geographic coincidence doesn’t explain the pattern. The settlement baseline test shows that ancient monuments cluster at 5× the expected rate while settlements in the same regions cluster below random. No other great circle — not one out of 10,000 tested — produces this monument-specific divergence. A negative control on 20,000 English scheduled monuments confirmed zero signal where expected. The pattern is unique to this circle and to monumental sites.
The signal survives the tightest null model. When we replace the original baseline with a kernel density model that preserves geographic clustering, the Megalithic Portal signal holds at Z = 9.5–14.6. Ancient Pleiades sites hold at Z = 5.1. The all-periods Pleiades signal correctly vanishes — confirming the KDE baseline is doing its job and the ancient signal is genuine.
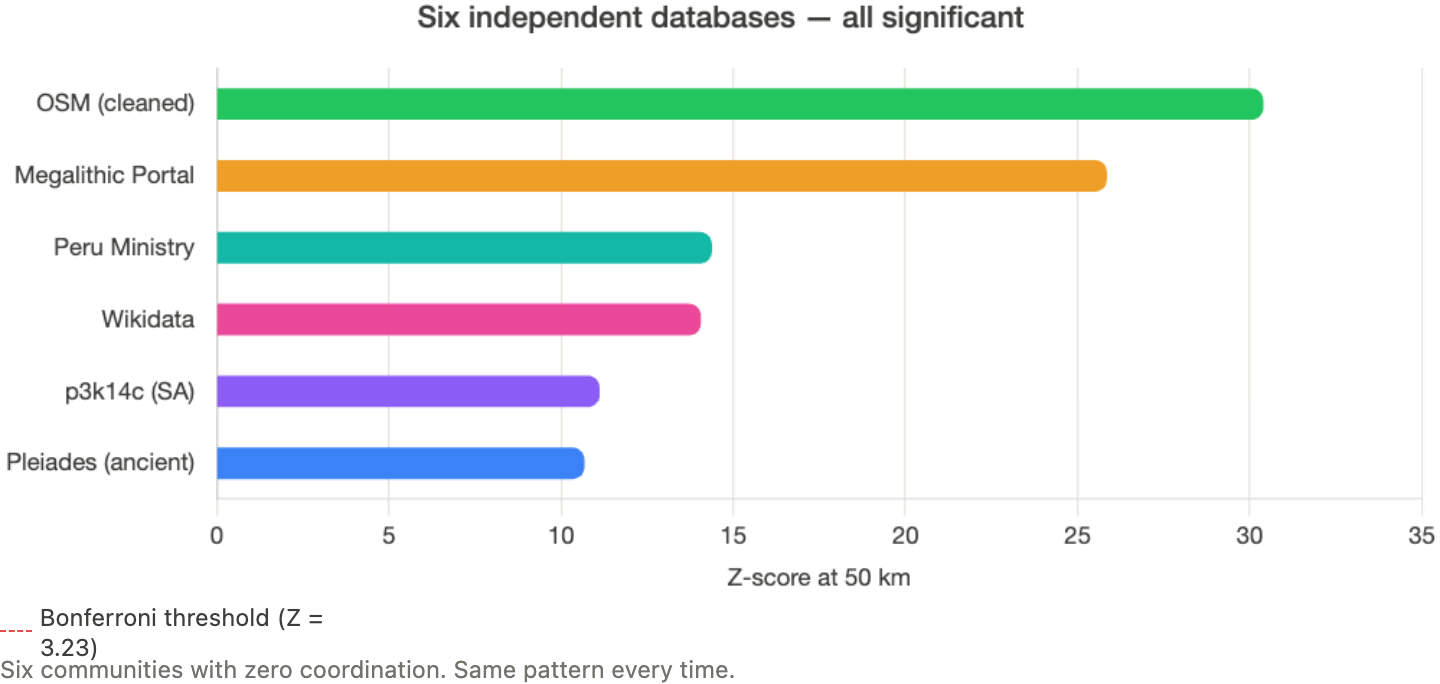
The signal replicates across six independent lines of evidence. The signal replicates across five independent databases. The Megalithic Portal (Z = 13.3), Pleiades ancient sites (Z = 10.68), p3k14c radiocarbon dates (Z = 7.86), and DARE Roman atlas — all confirm the pattern. p3k14c is a completely different data type (radiocarbon dates, not site locations) published in Nature's Scientific Data. DARE independently replicates the monument-settlement divergence (6.15). Historic England (20,000 monuments) confirms null where expected. The divergence survives without Egypt, without Africa, and independently in South America alone.
The signal isn’t database bias. Alison’s circle avoids Europe entirely. Among 100,000 random circles, every higher-scoring one passes through the UK and France. Among the 1,718 circles sharing Alison’s geographic profile — Middle East and South America, no Europe — it ranks #1. The enrichment comes from the exact regions the database covers worst.
Geology doesn’t explain it. The circle doesn’t follow any known plate boundary, magnetic lineament, or geophysical structure. The pole’s location in tectonically active Alaska appears coincidental.
There is more underground than we’ve found. Five of six clusters have documented subsurface anomalies — earlier construction phases, unexplored chambers, buried cities. The two without GPR data haven’t been surveyed.
The physical path existed. During the ice age, four of six clusters were connected by continuous dry land, including a fertile river valley the size of Great Britain that is now the Persian Gulf. No underwater archaeology has been conducted there.
The line misses important sites. Göbekli Tepe, Stonehenge, and Teotihuacan are nowhere near it. Two of six cradles of civilization are off the line entirely.
We are not claiming a lost civilization built these sites, and we are not claiming the overall alignment is unexplained — it is, by geography. The data doesn't support a lost civilization claim — construction dates span 10,000 years across culturally unrelated societies. What we are claiming is more modest but, we think, more interesting: the pattern of where humans chose to build their most ambitious monuments is not random, is not explained by geography, and is not fully understood. Something about these locations — something we haven’t identified — made them magnets for monumental construction across millennia and across cultures.
Whatever is driving this pattern, it is specific to the most monumental construction projects of the ancient world. Villages and farms in the same valleys, drinking from the same rivers, don't show it. The most productive next steps are concrete and fundable:
GPR surveys at every unsurveyed cluster. The Negev standing stone fields — thousands of unexcavated matsevot spread across the desert — have never had systematic ground-penetrating radar. Neither have Easter Island’s ahu platforms. These are the two biggest gaps in the subsurface record. Filling them would either strengthen the pattern or weaken it. Either outcome advances the science.
Deeper excavations at key sites. Sechín Bajo in Peru has the earliest known monumental architecture in the Americas — a circular plaza dating to 3600 BCE. How deep does it go? Giza and Saqqara have mapped anomalies that remain untouched. Persepolis sits on top of a buried city that’s barely been sampled.
Underwater archaeology in the Persian Gulf. The Gulf Oasis hypothesis is already taken seriously in the literature. The Great Circle transect gives it a specific target zone. A marine GPR survey along the circle’s path through the northern Gulf basin — 35 meters of warm, shallow water — could either find evidence of ice-age human activity or confirm its absence.
Systematic mapping of the Nazca-to-Cusco corridor. The Peruvian section of the Great Circle contains some of the most site-dense stretches — geoglyphs, pyramids, ceremonial centers — packed into a narrow band. A comprehensive survey connecting Cahuachi, the Nazca Lines, and Sacsayhuamán along the circle could reveal whether these sites relate to each other spatially in ways we haven’t recognized.
The data is asking a question.
The ground — and what’s beneath it — may hold the answer.
In Part 3, we test every alternative explanation we can find — geographic coincidence, database bias, geology, astronomy, ice-age connectivity, Bronze Age trade routes, and statistical artifact. Eight hypotheses. Eight tests. We report what survives.
Resources:
Full paper: https://zenodo.org/records/19081718
Code and data: github.com/thegreatcircledata
Interactive globe: thegreatcircle.earth
Follow: @greatcircledata